Equipment Status
To add this widget to your Dairy Dashboard or Overview page, check the box for it under the Feed category in the Page Customization options.
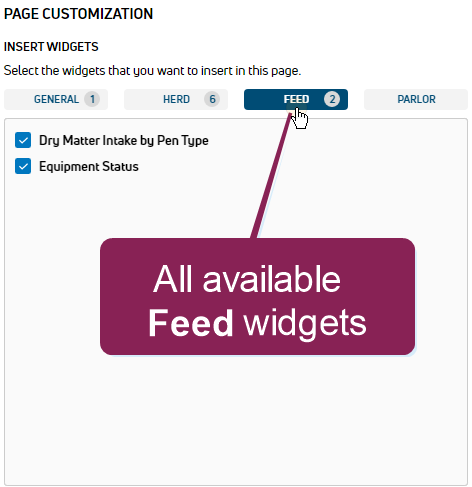
To view this widget on a Dashboard or Overview Page, your user account must be assigned to a Role with Feed Read permissions. See Edit Dairy User Permissions and Manage Dairy Roles for more information.
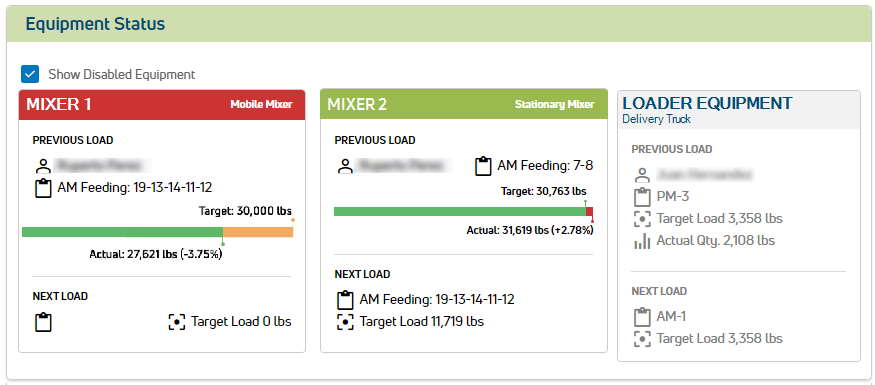
The Equipment Status widget displays the current status of feed mixers that are synchronized into the VAS PULSE Platform from FeedWatch. As shown in the example below, the colors in the equipment header boxes indicate the equipment status:
- A GREEN HEADER BOX indicates that the equipment connection is good.
- A RED HEADER BOX indicates a connection loss between the equipment and FeedWatch.
- A GRAY HEADER BOX indicates disabled equipment. This type of equipment is only displayed if the Show Disabled Equipment box at the top left of the widget is checked.
The example below illustrates the information displayed for each mixer![]() A piece of farm equipment that mixes all the loaded ingredients for a feed recipe. Mobile mixers are most common, but stationary mixers also exist..
A piece of farm equipment that mixes all the loaded ingredients for a feed recipe. Mobile mixers are most common, but stationary mixers also exist..
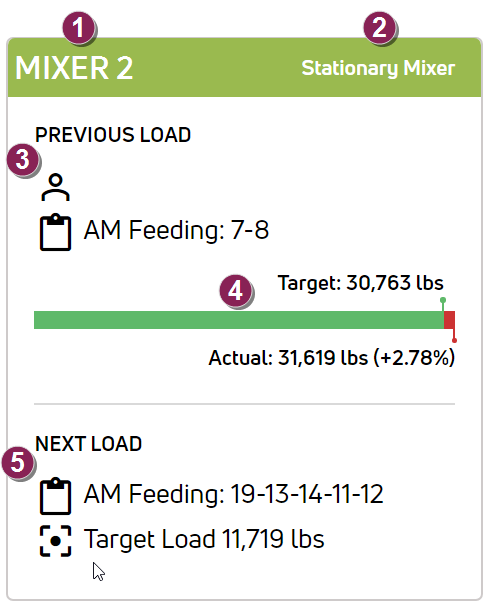
- Mixer
 A piece of farm equipment that mixes all the loaded ingredients for a feed recipe. Mobile mixers are most common, but stationary mixers also exist. name.
 - Mixer type.
- PREVIOUS LOAD details:
 The name of the dairy worker responsible for the load.
 The feeding period and pens where the feed was delivered (shown as AM Feeding for pens 7 and 8 in the example).
- Target vs Actual feed results:
- If the Actual amount delivered exceeds the Target amount, the values will be illustrated in green and red on the bar.
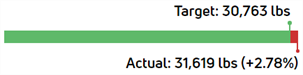
- In this case, the green part of the bar shows the Target amount that was delivered. The Target value is displayed by the green dot above the bar. In the example above, the green shows that the full Target amount of 30,763 lbs of feed was delivered.
- The red part of the bar shows how much the Actual amount exceeded the Target. In the example above, the Actual value of 31,619 lbs is displayed by the red dot below the bar, and the Actual amount that exceeded the Target is displayed as the percentage +2.78% next to the Actual weight value.
- If the Actual amount delivered is less than the Target, the values will be illustrated in green and orange on the bar.
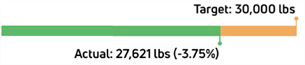
- In this case, the green part of the bar shows the Actual amount that was delivered. In the example above, the Actual value of 27,621 lbs is displayed by the green dot below the bar, and the amount that was less than the Target is displayed as the negative percentage -3.75% next to the Actual weight value.
- The orange part of the bar represents how much of the Target was not delivered. In the example above, the Target value of 30,000 lbs is displayed by the orange dot above the bar, and the orange portion represents the -3.75% difference between the Target and the Actual amount delivered.
- If the Actual amount delivered exceeds the Target amount, the values will be illustrated in green and red on the bar.
- NEXT LOAD details:
- The next scheduled feeding period and pens (shown as AM Feeding for pens 19, 13, 14, 11, and 12 in the example above).
 The target weight for the next load (shown as 11,719 lbs in the example above).