Cows: 21-day Pregnancy Risk
To add this widget to your Dashboard or Overview page, check the box for it under the Herd category in the Page Customization options.
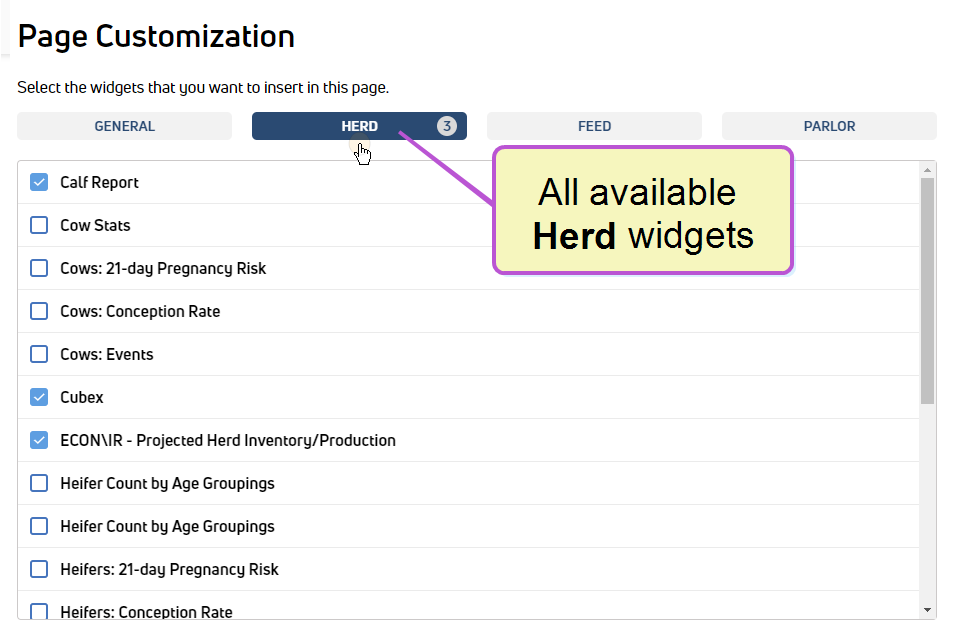
To view this widget on a Dashboard or Overview Page, your user account must be assigned to a Role with Herd Read permissions. See Edit Dairy User Permissions and Manage Dairy Roles for more information.
The Cows: 21-day Pregnancy Risk widget charts the insemination risk, pregnancy risk, and confidence interval (CI) for recent 21‑day intervals. This widget reflects data only for
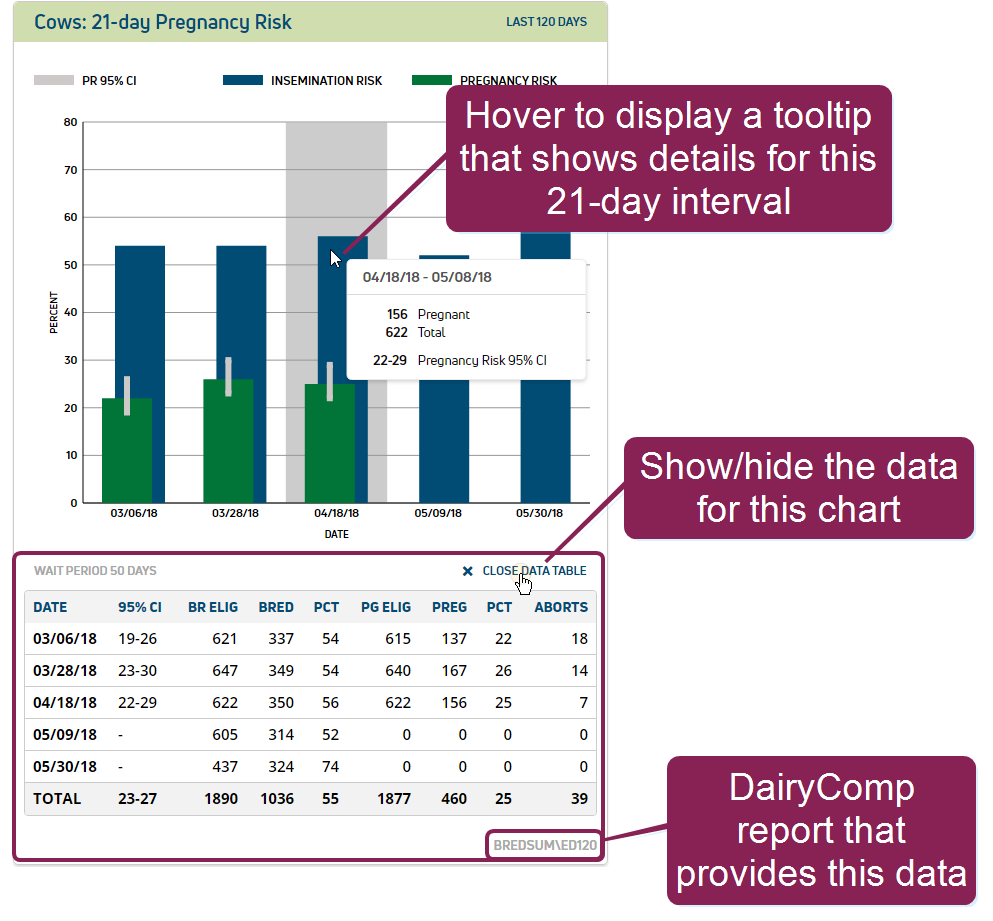
Follow these guidelines when reviewing the data in this widget:
- The dates displayed beneath each bar in the chart represent the start date for each 21‑day interval.
- The dark blue bar represents the insemination risk.
- The green bar represents the pregnancy risk.
- The gray "wick" represents a 95% Pregnancy Risk (PR) Confidence Interval (CI), meaning that based on this data, you can be 95% confident that the results will fall within this range. For instance, if the wick reflects a 95% CI of 19-26, it means that you can be 95% confident in a resulting pregnancy rate of 19%-26%.
- Click the View Data Table link at the bottom right of the chart to view the specific data that builds the chart:
- DATE: Start date of each 21‑day interval.
- 95% CI: The lower and upper confidence limits (CLs). For example, a 95% CI of 19‑26 indicates that 19% is the lower CL and 26% is the upper CL.
- BR ELIG: The number of animals entering the 21-day interval that are eligible to be inseminated.
- BRED: The number of animals actually inseminated.
- PCT: The percent of animals detected in heat (calculated by BRED / BR ELIG).
- PG ELIG: The number of animals entering the 21-day interval that are eligible to become pregnant.
 Tell me more about BR ELIG and PR ELIG!
Animals that were present for at least half of the 21-day cycle (11 days) are considered bred eligible. Bred eligible animals are then considered preg
Pregnant eligible following the 21-day cycle as long as the breeding result is not set or remains unknown. If a bred animal is culled from the herd during the preg eligible period, she is included in the bred eligible total but not in the preg eligible total. Therefore, the preg eligible total is always the same as or less than the bred eligible total. - PREG: Number of pregnancies.
- PCT: Percent of pregnancies (calculated by PREG / BR ELIG).
- ABORTS: The animals that were confirmed pregnant but later lost the pregnancy.