Heat Detection CowCard Widget Details
For the Partners tab to display heat and health data, DairyComp Unlimited dairies must first to activate the integration. See Activate Integration to learn more.
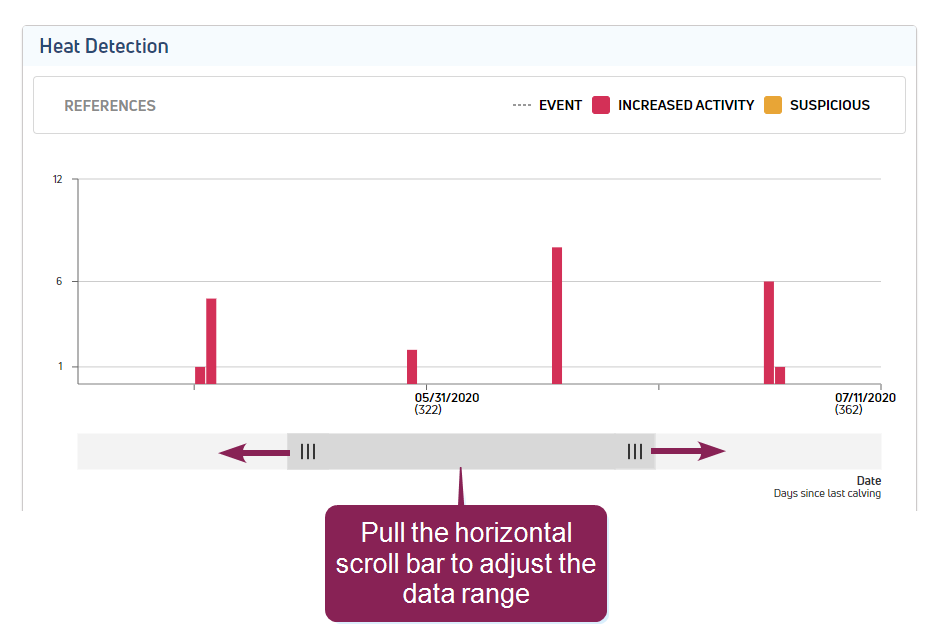
View the example below for more information on the data shown in the Heat Detection widget.
|
1
|
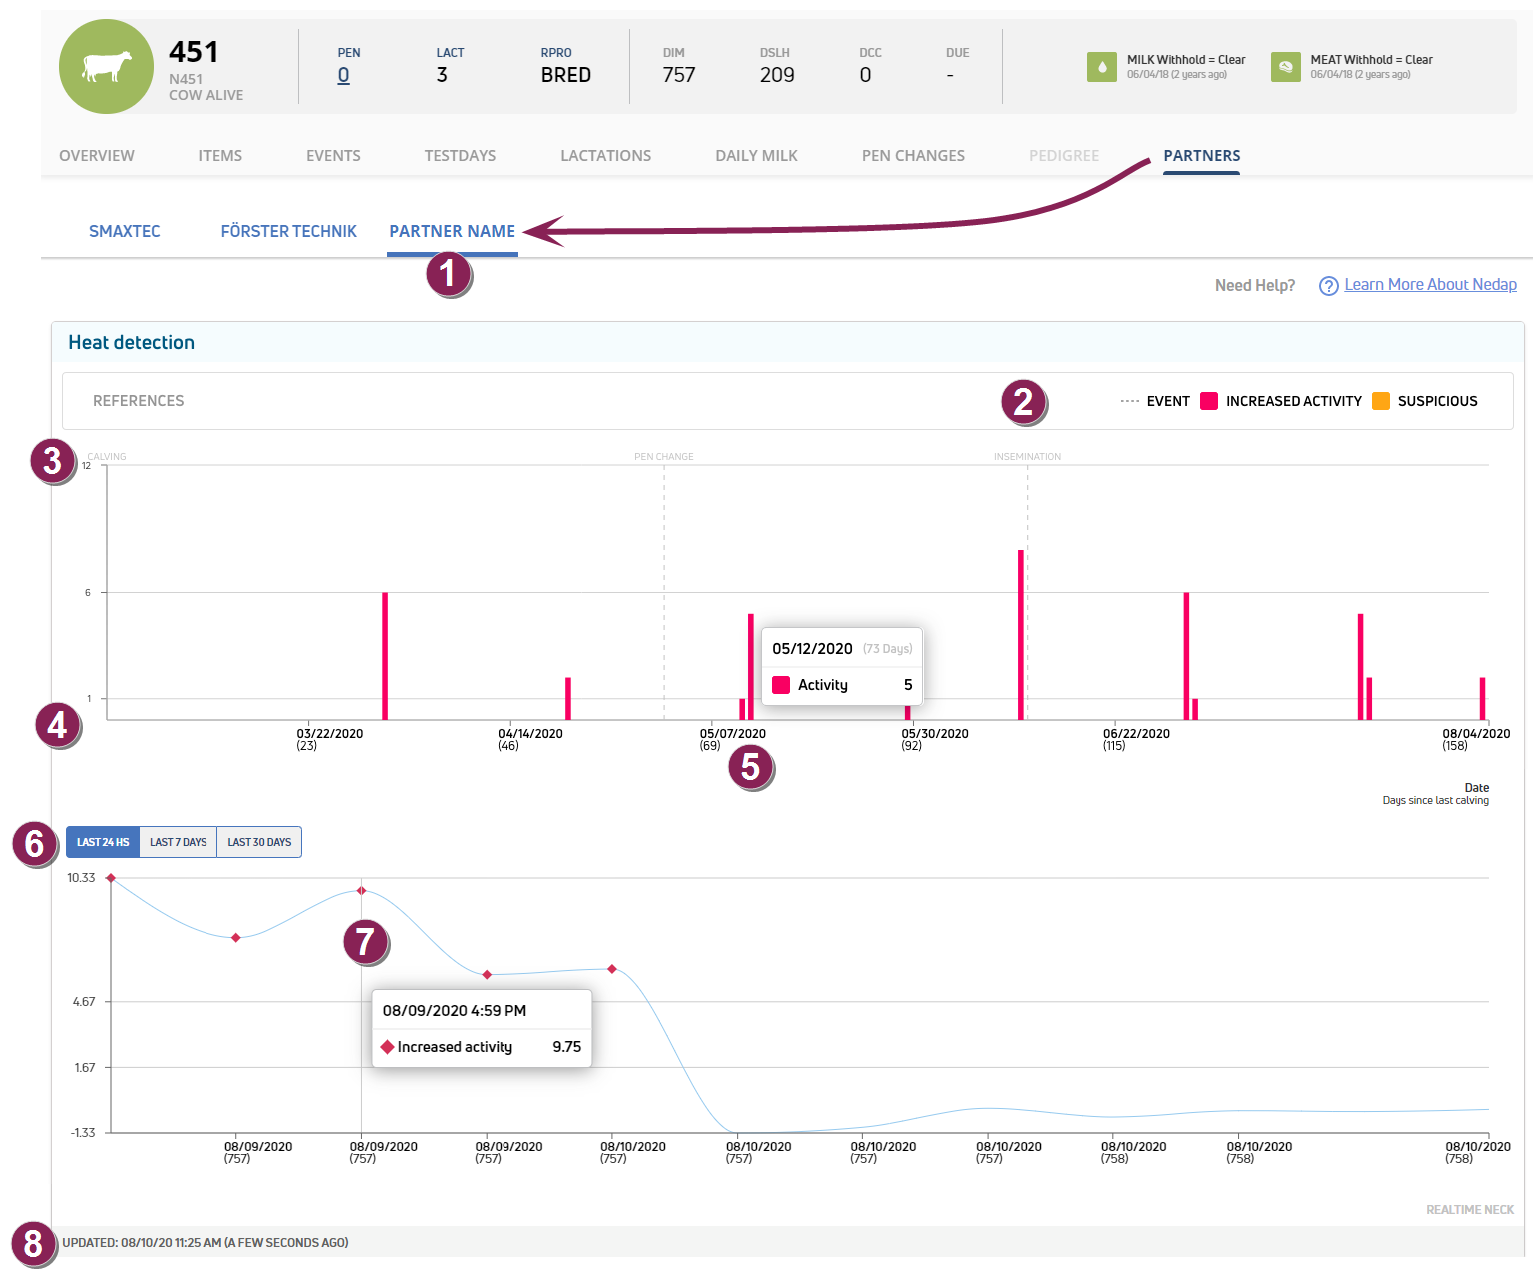
Partners tab: To view the widget, select the Partner Name from the Partners tab on the animal's CowCard. |
|
2
|
References: The heat detection graph includes the following data:
|
|
3
|
Events: Animal events captured by VAS, including calving, insemination, pregnancy checks, and pen changes, are noted on top of the graph with a dashed line. |
|
4
|
Date (days since calving): The x-axis on the graph includes the date, as well as the number of days since calving in parenthesis. If the current lactation is longer than 200 days, use the horizontal scroll bar at the bottom of the graph to adjust the viewable date range.
|
|
5
|
Detail: Hover over the graph data to view the activity reading detail. |
|
6
|
View: Choose to view widget data for the last 24 hours, 7 days, or 30 days. |
|
7
|
Detail: Hover over the graph data to view the activity reading at a specific date and time. |
|
8
|
Updated: Timestamp (date and time) widget data was refreshed. Sensor data is updated in PULSE every two hours. |