Projections
Use the Projections dashboard to view monthly projections of your inventory, including the number of milking cows, dry cows, calves, and more, for the next six months. Use these projections to make well-informed inventory decisions in the future.
Follow the steps below to continue:
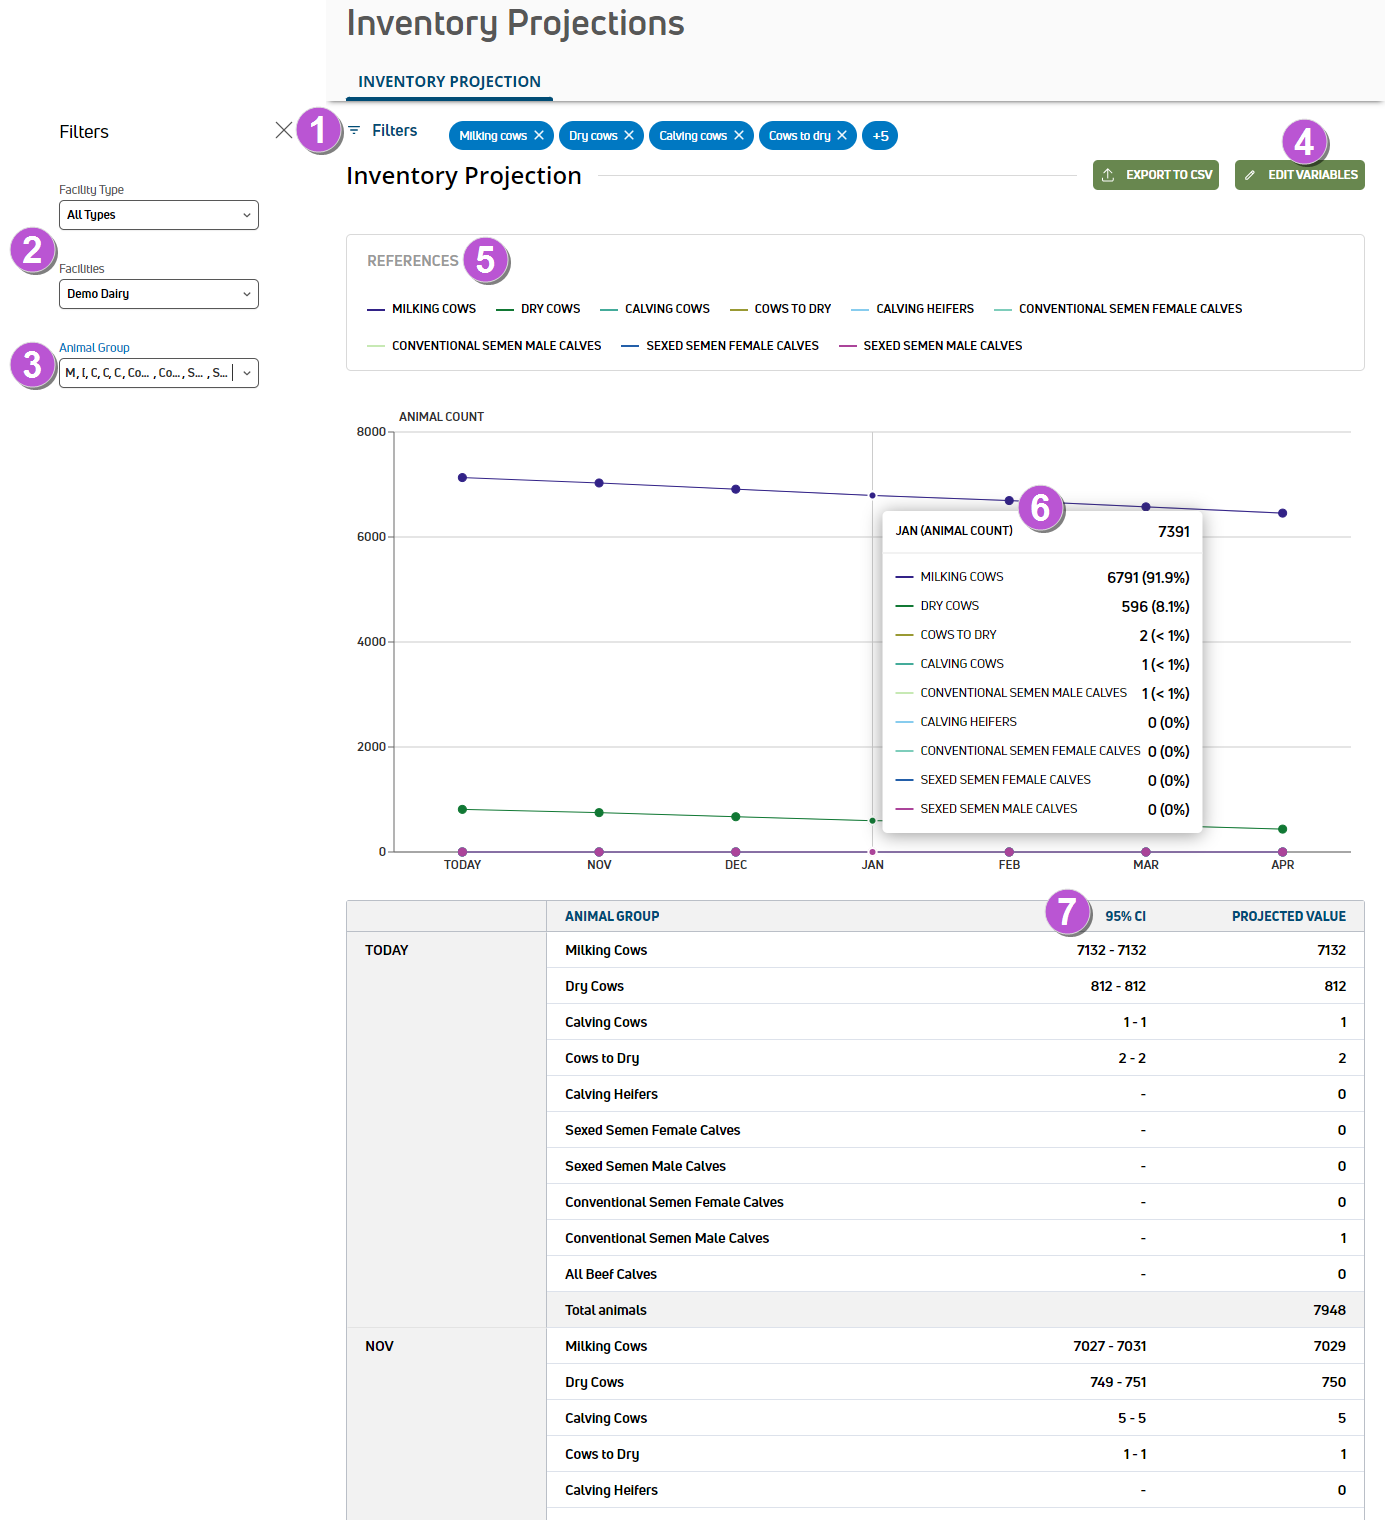
- Filters: Click the Filters option on the upper left side of the dashboard to open a side panel where you can manage the data you see in the graph:
- Facility filters: Use the Facility Type and/or Facilities filters to manage the facilities shown in the graph. Facilities are listed by dairy name. By default, the graph includes data from all dairies.
- Animal group filter: By default, this graph includes all animal groups. Select the animals groups shown in the graph.
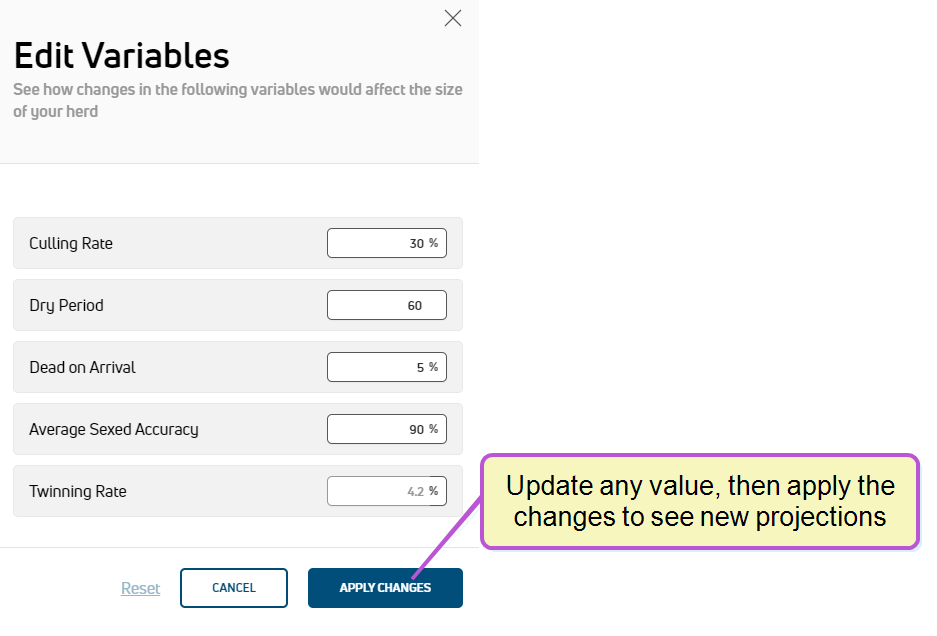
- Edit variables: On the upper right side of the screen, click Edit Variables to change the variable data to see possible outcomes for different scenarios. The system opens a side panel where you can edit Culling Rate, Dry Period, Dead on Arrival, Averaged Sexed Accuracy, and Twinning Rate.
- Culling Rate: Percentage of animals that are SOLD or DIED.
- Dry Period: Number of days animals are not milked between lactations.
- Dead on Arrival: Percentage of calves born dead.
- Average Sexed Accuracy: Average percentage of female calves born after conception from sexed semen.
- Twinning Rate: Percentage of births that result in twins. Currently, this variable cannot be changed and is based on an industry standard.
- References: Each animal group is represented on the graph by its own colored line.
- Tooltips: Hover over the graph data to view more detailed information, including animal counts and percentages.
- 95% CI: The 95% confidence interval (CI) measures the degree of certainty or uncertainty in the system's sampling. A high confidence interval indicates the system has more uncertainty in the accuracy of the projection. A low confidence interval indicates more certainty in the accuracy of the projection.