Pregnancy Risk
Use the Pregnancy Risk page to examine the factors that impact your herd's pregnancy risk. Click Filters at the top left of the page
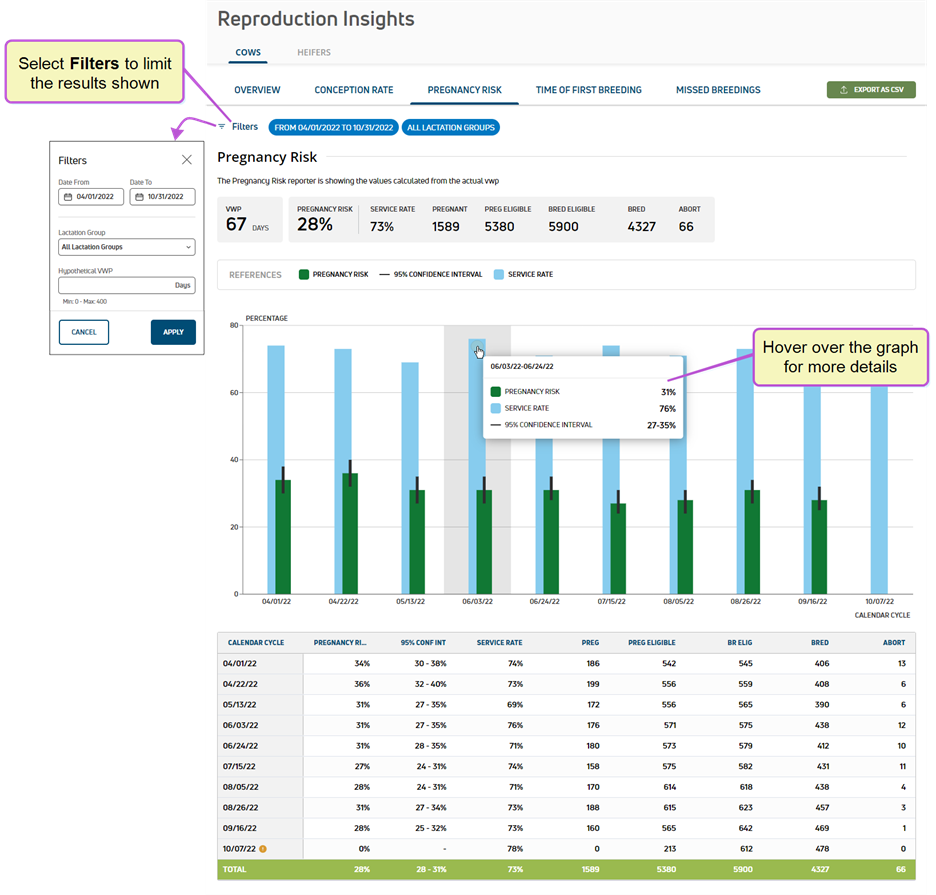
The gray box
- VWP
 Voluntary wait period, or the number of days a dairy chooses not to breed a cow after calving.: The
 - Pregnancy Risk: Your herd's overall pregnancy risk, displayed as a percentage. A higher pregnancy risk indicates a more efficient breeding program.
- Service Rate: The breeding-eligible-animals that were actually inseminated during a 21-day cycle, displayed as a percentage.
- Pregnant: The number of animals currently pregnant.
- Preg Pregnant Eligible: The number of animals entering the 21-day interval that are eligible to become pregnant.
- Bred Eligible: The number of animals entering the 21-day interval that are eligible to be inseminated. An eligible animal is defined as having passed the voluntary waiting period, is not currently pregnant, and is active in the reproductive program.Tell me more about Bred Eligible and Preg Eligible!
Animals that were present for at least half of the 21-day cycle (11 days) are considered bred eligible. Bred eligible animals are then considered preg eligible following the 21-day cycle as long as the breeding result is not set or remains unknown. If a bred animal is culled from the herd during the preg eligible period, she is included in the bred eligible total but not in the preg eligible total. Therefore, the preg eligible total is always the same as or less than the bred eligible total.
- Bred: The number of animals actually inseminated.
- Abort: The animals that were confirmed pregnant but later lost the pregnancy.
The graphed data helps to visualize your overall pregnancy risk as well as the confidence interval:
- References: Each reference is color-coded to match a specific bar or line on the graph.
- The black "wick" represents a 95% confidence
- If there is not enough data to calculate a 95th percentile confidence interval, the
 icon is displayed in the table below the graph.
 - Hover over a bar on the graph to view additional data.
- Scroll down to view the graphed data in a table format.
![]() at the top right of the page to save the data as a CSV file. If you applied filter(s), the data will print with the current filter(s) applied.
at the top right of the page to save the data as a CSV file. If you applied filter(s), the data will print with the current filter(s) applied.