Conception Rate
Use the Conception Rate page to examine the factors that impact your herd's conception rate. Click Filters at the top left of the page
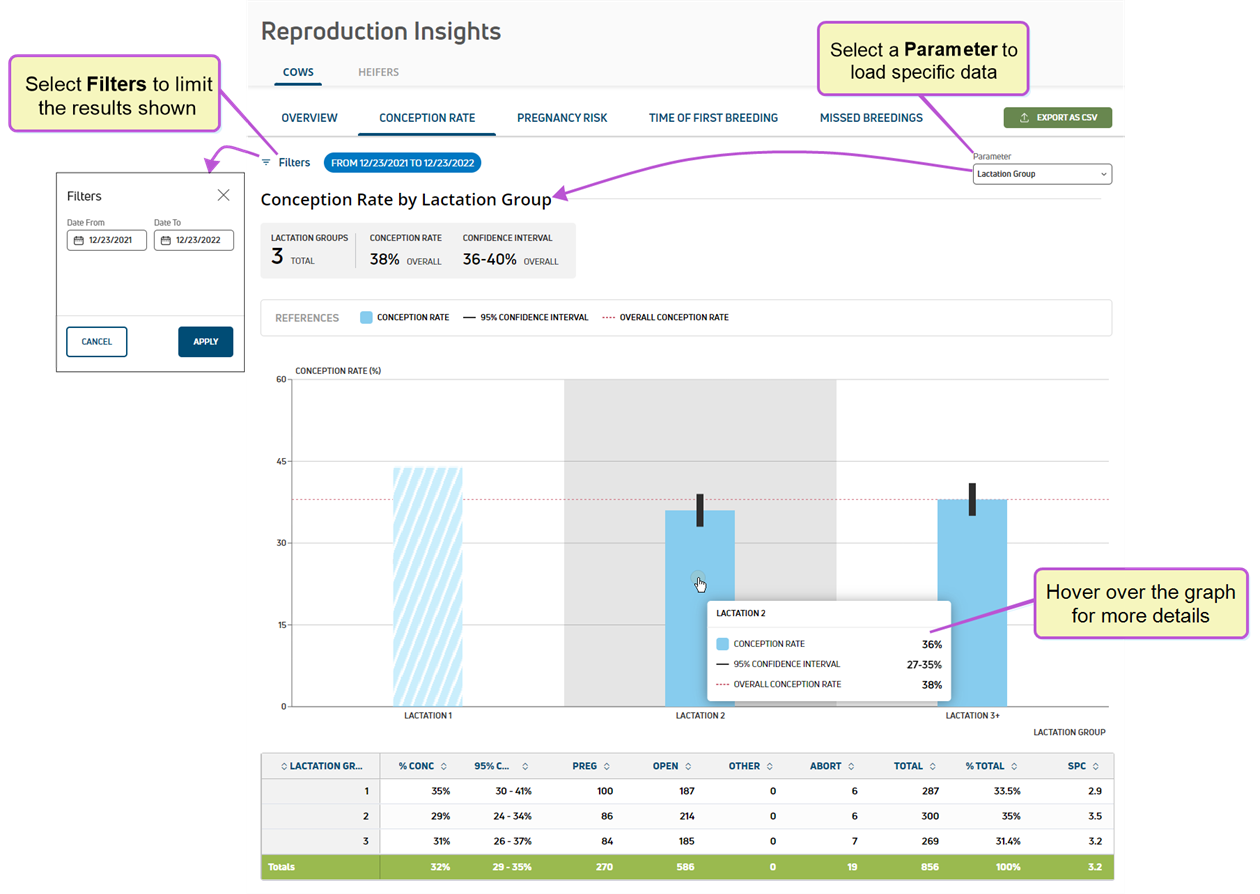
The gray box at the top of the page summarize
- Total: The total number of conceptions that occurred.
- Overall Conception Rate: The herd's overall conception rate, displayed as a percentage.
- Overall Confidence Interval: A summarized percentage of the 95th percentile confidence interval. In the example above, the overall confidence interval is 36-40%. This means that you can be 95% confident in a conception rate between 36%-40%.
The Parameter option allows you to drill down into your conception rate data so that you can easily identify your dairy's top performers. You can choose from the following options:
- Lactation Group: View data sorted by the lactation status of cows in your herd. This parameter is not available for heifers.
- Technician: View data sorted by the breeding technicians on your dairy team.
- Stud Code: View data sorted by the individual stud codes assigned to sires in your herd.
- Breeding Code: View data sorted by the different types of breeding events that occur across your herd.
- Breed: View data sorted by the individual sire breeds within your herd.
- Month: View data sorted by calendar month.
- Breeding Cycle: View data sorted by transitions in your animals' breeding cycles.
- Heat Interval: View data sorted by the number of days in your animals' heat cycles.
- Week Day: View data sorted by each day of the week.
- Times Bred: View data sorted by the number of times your animals were bred.
- Sires: View data sorted by sires used by the dairy. Once selected, additional filter options, such as breed, stud code, semen type, etc., are available.
The graphed data helps to visualize your overall conception rate as well as the confidence interval:
- References: Each reference is color-coded to match a specific bar or line on the graph.
- The black "wick" represents a 95% confidence
- If there is not enough data to calculate a 95th percentile confidence interval,
 icon is displayed in the table below the graph.
 - Hover over a bar on the graph to view additional data.
- Scroll down to view the graphed data in a table format.
![]() at the top right of the page to save the data as a CSV file. If you applied filter(s), the data will print with the current filter(s)
at the top right of the page to save the data as a CSV file. If you applied filter(s), the data will print with the current filter(s)